Our first test of LFP’s was about their response to a large load. The second test was to a small load, essentially a longevity test.
For this test I hooked one LFP cell up to a boost converter and then on to an Arduino ProMini to see what the voltage curve looked like over time.
Here’s a picture of the setup. The cell, number 38, sits in a holder which is attached via alligator clip leads to a AA battery holder which connects to a 3.3V boost converter which in turn goes to an Arduino ProMini board. The ProMini board has a radio, which is used to send the voltage readings to a Central Controller, and a display.

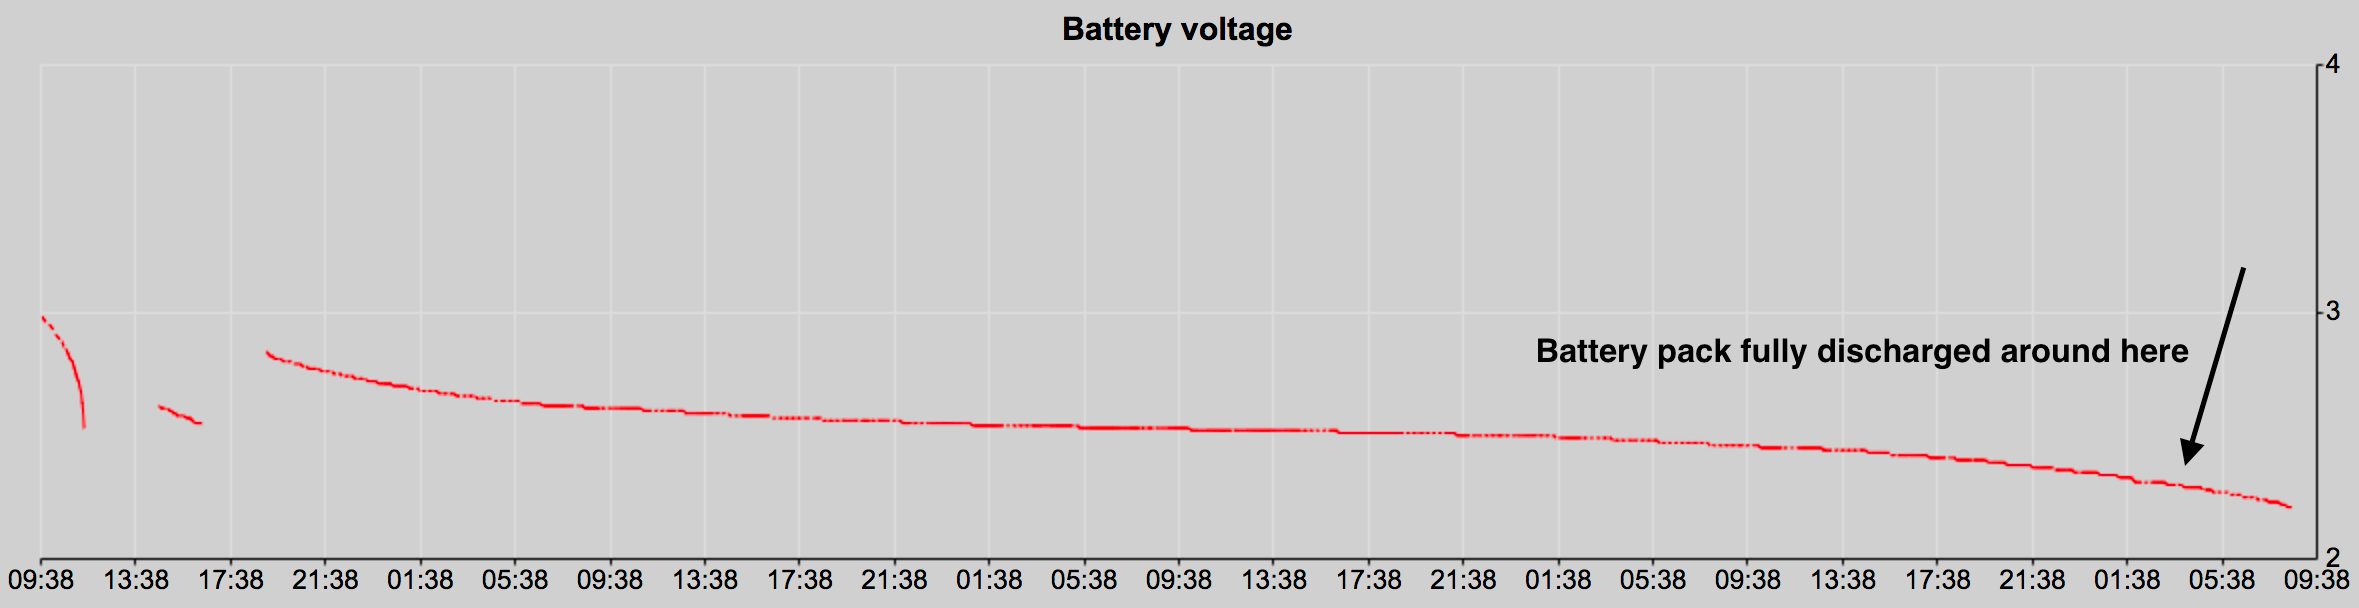
This ran for a little over 3 days and the results were surprising, especially when compared to the 6W light load test done previously. Here’s the voltage graph.
The cell voltage drop over the bulk of the test was very small, and when it hit the knee it dropped very quickly indeed. The almost unchanging voltage would make it quite difficult to accurately determine SOC from the voltage alone.
And if you’re thinking that 3 days isn’t very long, then you’re right. But there are reasons. The sketch running on this ProMini is not using any power saving techniques at all, and the addition of the OLED display increases the current draw.
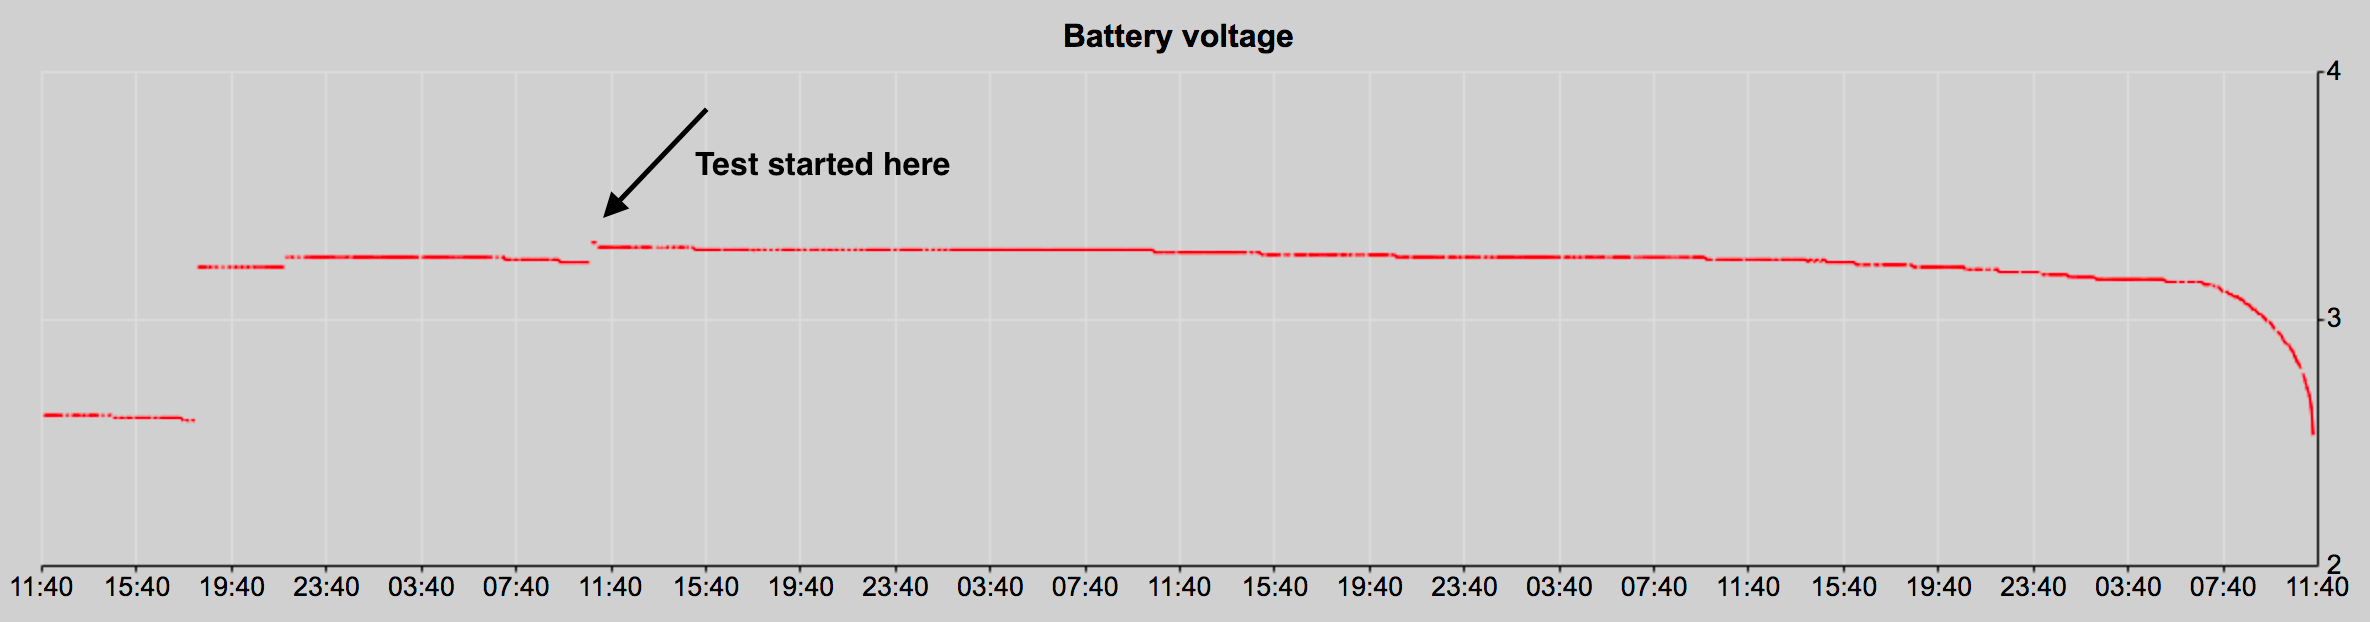
As a point of comparison, here’s a voltage graph using 2 AA NiMH 2500mAh eneloop batteries, fully charged, attached to the same ProMini as above. The test ran 3 days 4 hours, and also ran past the point of maximum discharge (because I was asleep at 3:30am when that happened) for another 5 or so hours, but the batteries recovered enough for them to be recharged again.